Visualize your data
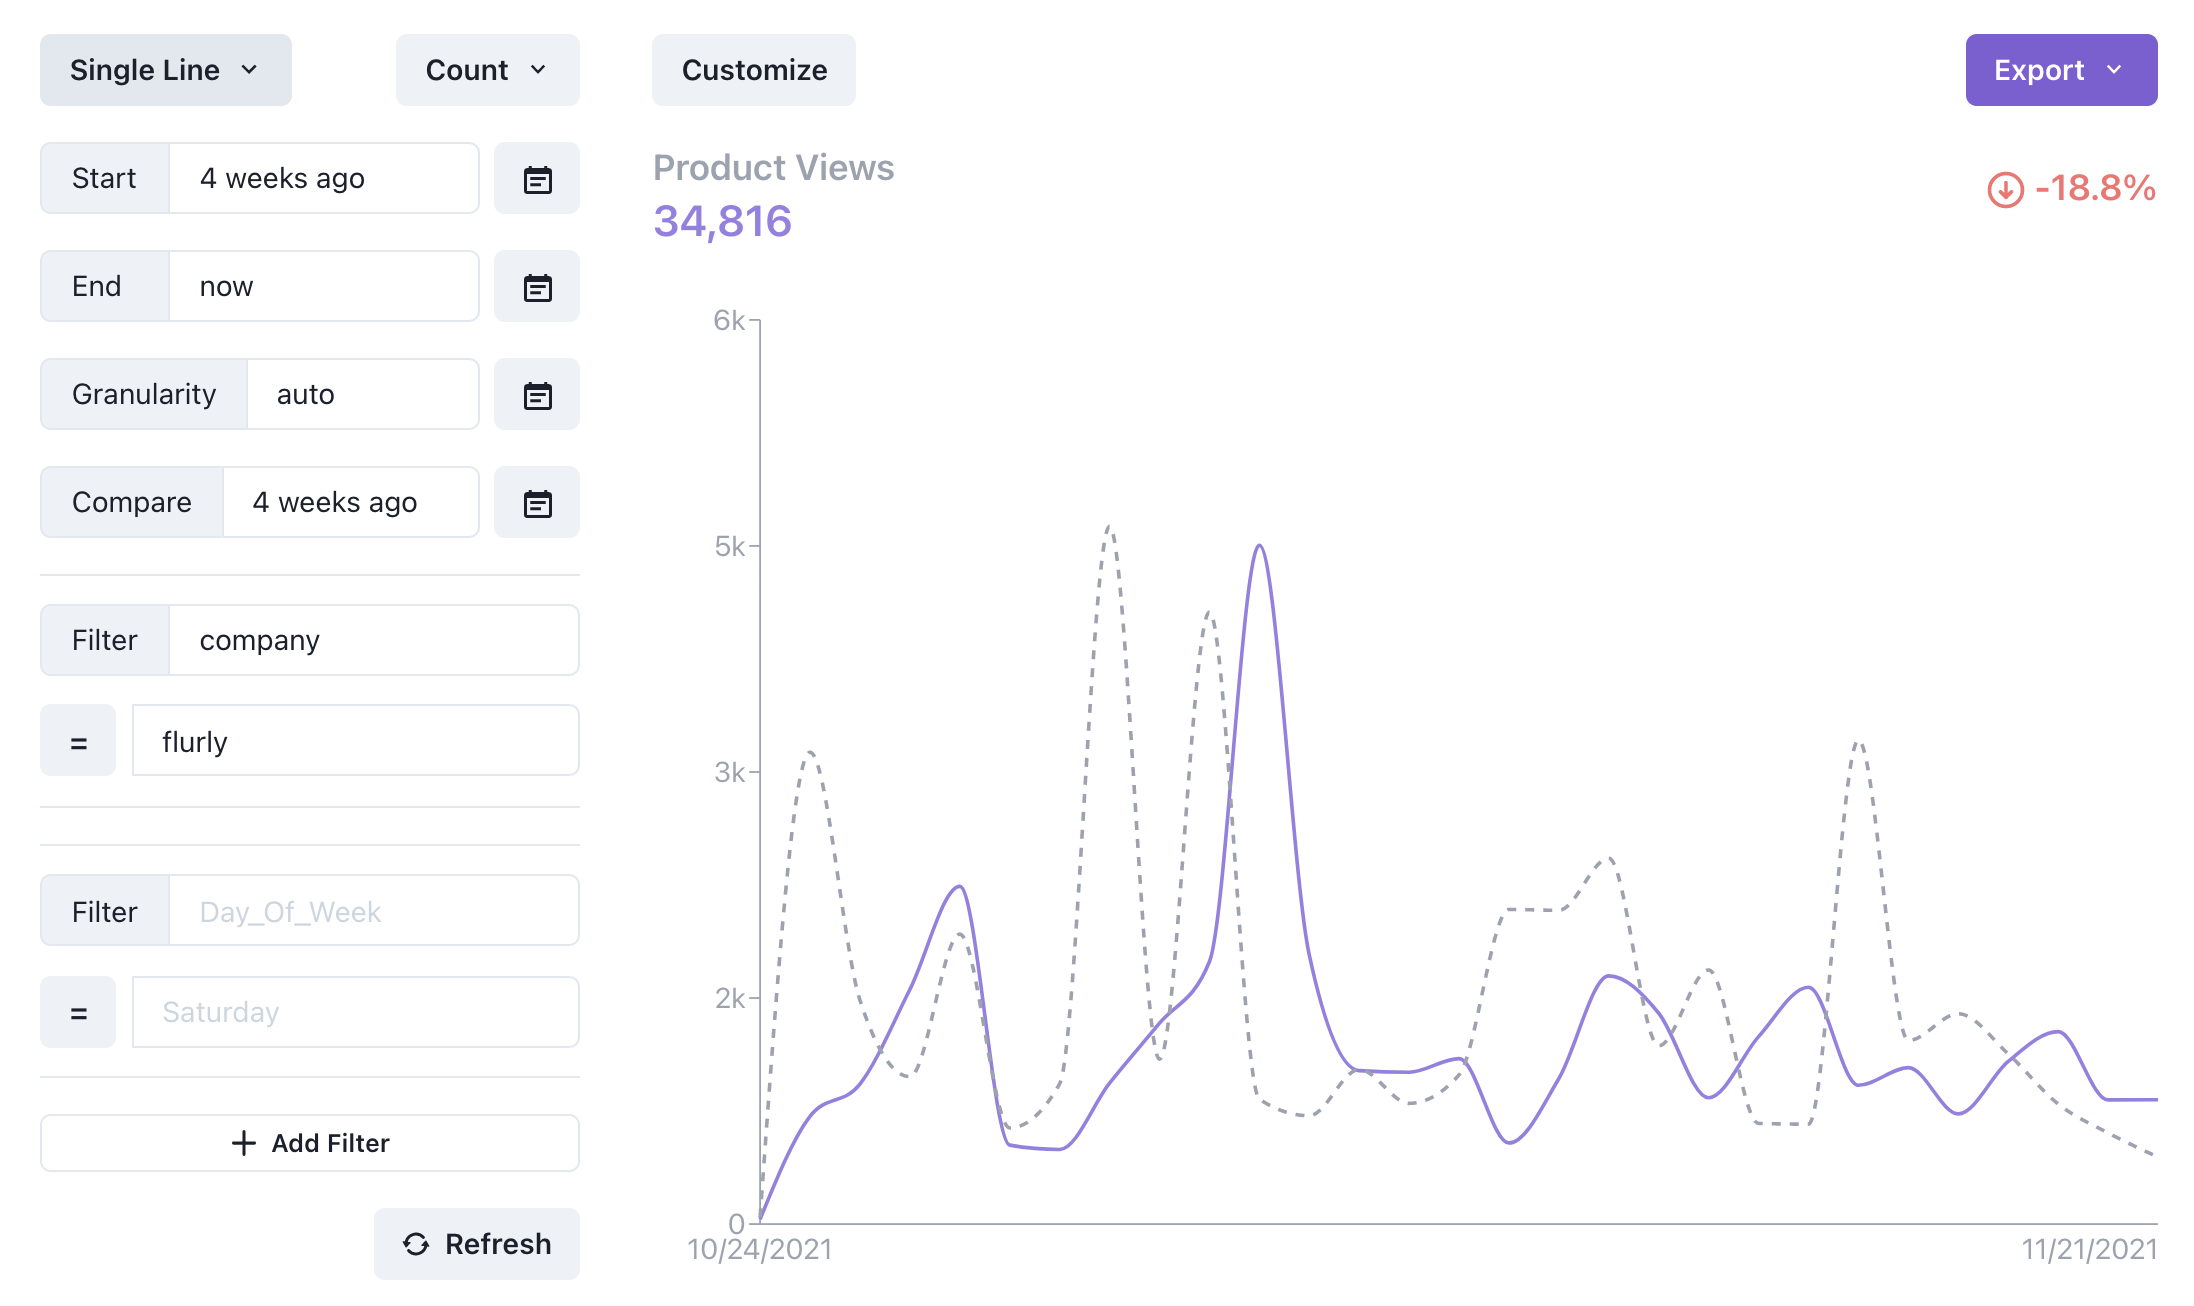
After getting data into your collections, you can use the visualizer tool to slice and dice your data. You can do so by clicking into your collection and clicking on the "Visualize" tab. “Single Line” & “Samples” are great visualizations to start off with to get a sense of what your logged data looks like.
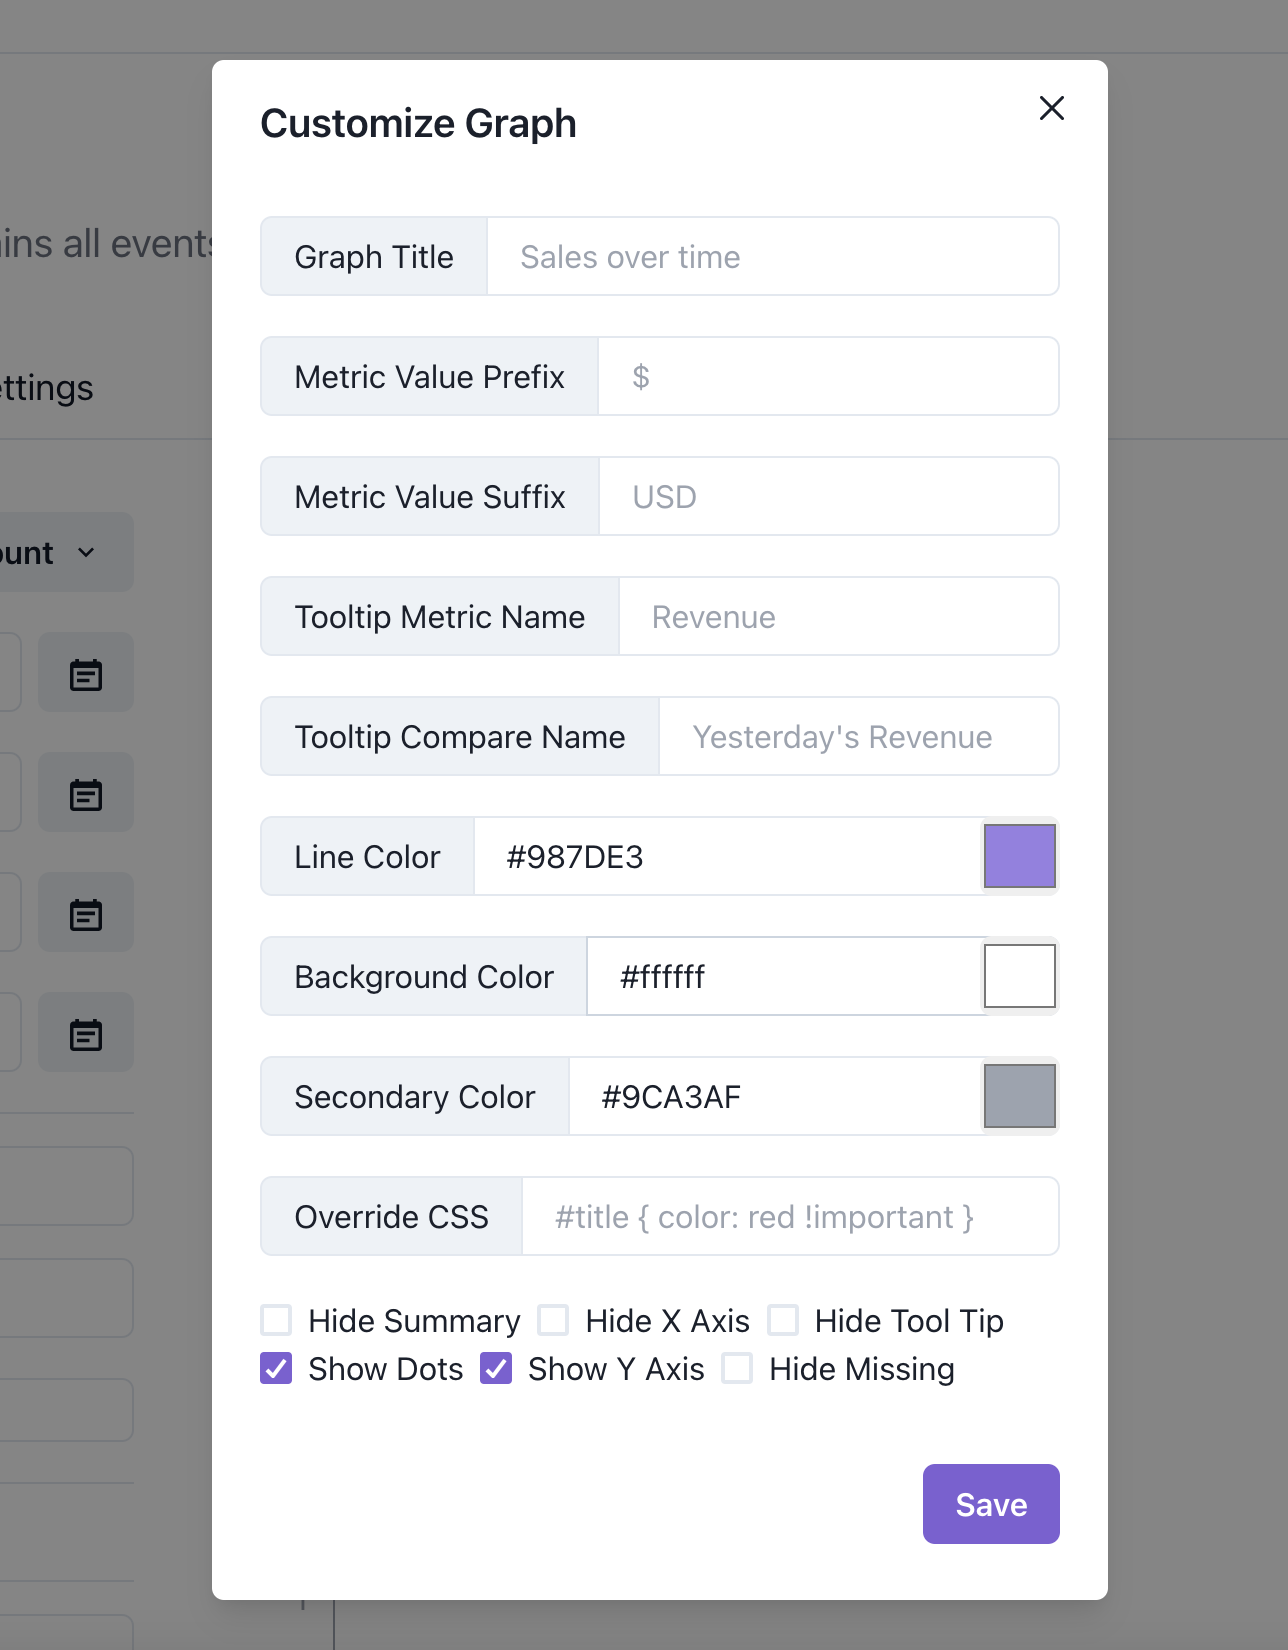
You can also customize the following attributes of the graph by clicking on the “Customize” button: